Chromium Network Interception for Traffic Analysis
Understanding the two complementary layers for intercepting Chromium traffic.
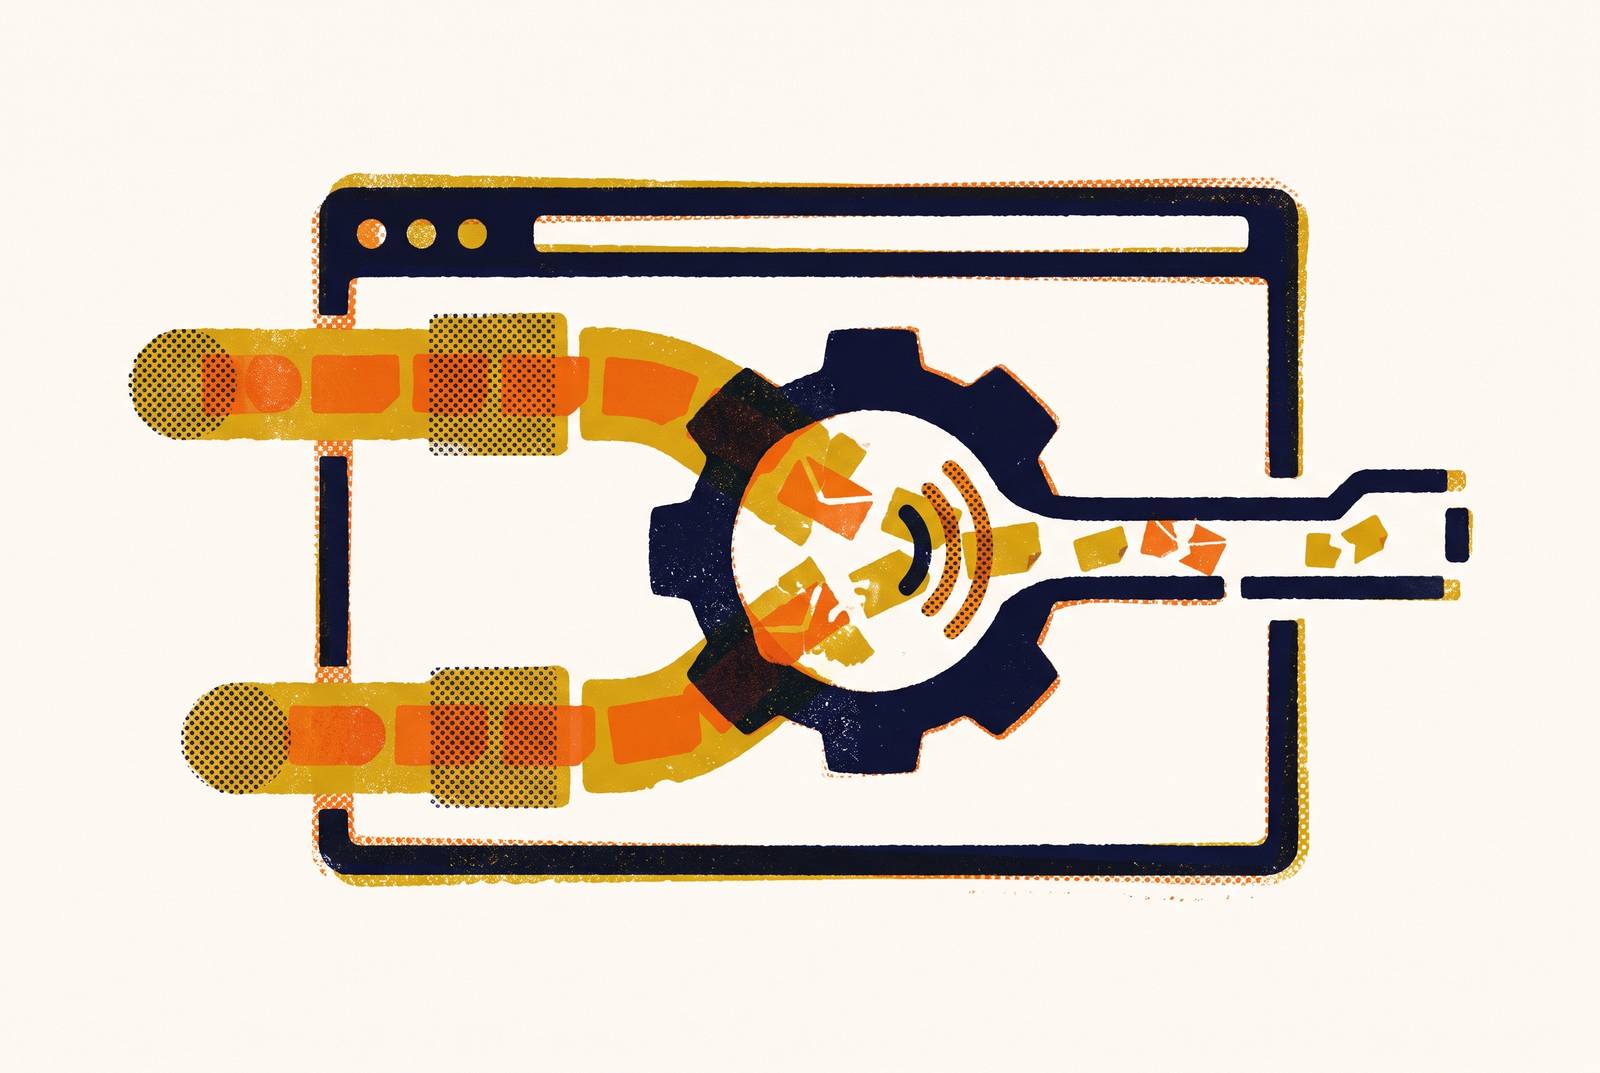
Chromium powers Chrome, Edge, Brave, Opera, and a long tail of derivative browsers. That means it controls the network stack for the majority of global web browsing. If you are analyzing web traffic at any scale, you are almost certainly analyzing Chromium traffic. The question is not whether to intercept it, but which layer to use and why.
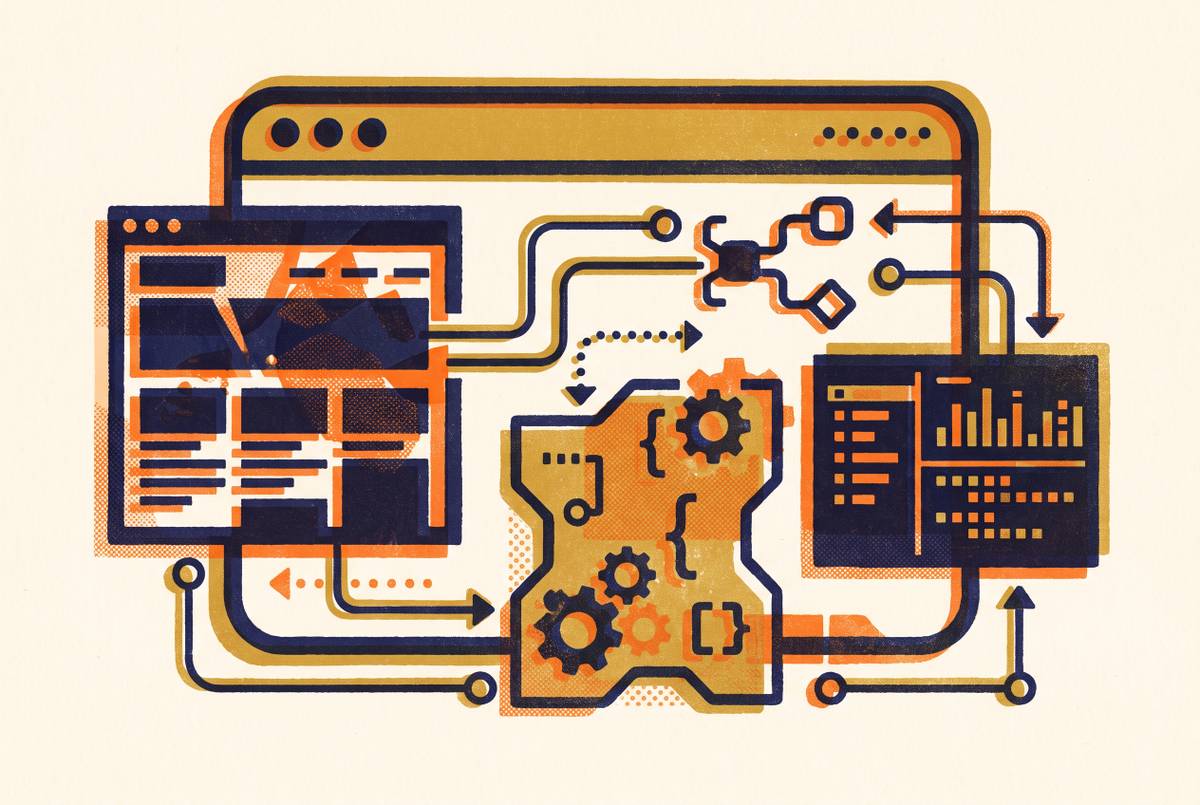
"Network interception" means something specific here: capturing, inspecting, modifying, or blocking HTTP and HTTPS requests and responses as they move between a browser and a server. There are two fundamentally different places to do that work. The first is inside the browser itself, using the Chrome DevTools Protocol, browser extensions, or automation libraries that sit atop CDP. The second is outside the browser, using a proxy that positions itself between the browser and the server at the network level. These two approaches are not competing answers to the same question. They are complementary tools with different units of analysis. Browser-side tools give you per-page, per-session visibility into what a single browser instance does. Proxy-side tools give you infrastructure-wide capture across every application and device on a network.
The tradeoffs practitioners face come down to four variables: granularity versus breadth, setup complexity, HTTPS handling, and protocol support. A complete toolkit requires understanding both layers well enough to deploy them separately, and sometimes simultaneously.
How the Chrome DevTools Protocol Exposes the Browser's Network Layer
CDP is a JSON-RPC style interface delivered over a WebSocket connection. Any language that can speak WebSockets and parse JSON can become a CDP client. That openness is why every major automation library, across Node, Python, Go, and Java, is built on top of it.
Two domains within CDP handle network interception, and they are not interchangeable.
The Network Domain
The Network domain is observational. It fires events that trace the lifecycle of a request: before a connection is established, before headers are sent, when a response is received. It gives you a detailed record of what happened. It does not let you pause and modify traffic in flight.
A few edge cases are worth knowing. The Network domain has supported WebSocket handshake interception since Chrome 58, and WebTransport handshake interception since Chrome 96. What it does not expose is individual messages over an already-established WebSocket or WebTransport session. The connection setup is visible; the message stream is not. Separately, CORS preflight requests are hidden from Network domain listeners by default since Chrome 79. If you need to see those, you must specify extraHeaders explicitly.
The Fetch Domain
The Fetch domain is the current canonical API for active interception. It is designed for intervention: pause, inspect, and modify requests or responses before they continue. The key commands are Fetch.enable, Fetch.continueRequest, Fetch.failRequest, Fetch.fulfillRequest, and takeResponseBodyAsStream. Interception happens at two stages: "Request" before the request is sent, and "HeadersReceived" when you need to modify a response.
One correlation detail matters for unified analysis. When a Fetch domain intercept corresponds to a Network domain event, the networkId in the Fetch domain matches the requestId from requestWillBeSent in the Network domain. That bridge enables you to combine observational data with interventional data in a single analysis pipeline.
Network.setRequestInterceptionEnabled is obsolete. Older tutorials still reference it, and it still surfaces in search results. The current API is Fetch.enable combined with Fetch.requestPaused. If you are following a guide that uses the old method, update your approach before you build on it.
What CDP gives practitioners that no proxy can replicate is access to the JavaScript execution context, the DOM, and tight coupling with browser events. That enables correlating specific requests with user interactions, DOM mutations, or JavaScript errors.
How Browser Extensions Intercept Network Traffic and Why Manifest V3 Changed the Rules
The Manifest V2 baseline gave extensions the webRequest API, which provided synchronous, blocking access to every request before it left the browser. The visibility was broad. The privacy exposure and latency cost were real. Extensions running JavaScript in the blocking path of every request became a meaningful attack surface and a source of measurable slowdowns.
Manifest V3 replaced runtime interception with declarativeNetRequest. Rules are declared in JSON and evaluated natively by Chrome. Extensions no longer run JavaScript in the blocking path of a web request. The architecture is faster and more private by design. Dynamic rules can be added, removed, and updated at runtime via updateDynamicRules and updateSessionRules. Rule quotas expanded significantly starting around Chrome 120, making the approach practical for a much wider range of filtering and blocking scenarios.
The critical limitation for traffic analysis is this: modifying an in-flight request by consulting an external service is explicitly unsupported in MV3. That pattern, where an extension paused a request, queried an external system for a decision, and then modified or blocked accordingly, was a common architecture for analysis tools. It is gone for public extensions.
There is an enterprise carve-out worth knowing. Blocking webRequest survives in MV3 for extensions force-installed via Chrome enterprise policies, specifically ExtensionSettings and ExtensionInstallForcelist. For internal tooling and corporate monitoring contexts, that pathway remains open.
For traffic analysis use cases requiring in-flight modification or external consultation, CDP-based automation or proxy-based interception is the right layer.
Puppeteer and Playwright as Practical CDP Wrappers for Traffic Analysis
Both libraries sit atop CDP and abstract away the raw WebSocket and JSON-RPC plumbing. They expose interception differently, and they carry different blind spots that matter in practice.
Puppeteer
Puppeteer, Google's original headless Chrome automation library introduced in 2017, pioneered the pattern of driving Chrome with JavaScript. It has accumulated over 94,000 GitHub stars as of early 2026.
page.setRequestInterception(true) is the primary interception surface. It lets you monitor URLs, methods, headers, and payloads, and lets you modify, block, or simulate responses. There is a cache side effect that is easy to miss: enabling request interception disables the browser cache. Resources that would normally be served from cache are fetched from the network instead. This skews performance measurements and makes any analysis of cache behavior unreliable. The workaround is to use a raw CDP session to set blocked URLs directly; the cache remains active through that path.
Playwright
Playwright, Microsoft's 2020 entry into the space, provides a unified API across Chromium, Firefox, and WebKit. Its auto-wait capabilities and multi-page handling are more mature than Puppeteer's defaults. As of June 2026, it sits at roughly 90,000 GitHub stars. Weekly npm download volume tells a more decisive story: Playwright runs at approximately 57.6 million downloads per week versus Puppeteer's 10.7 million.
page.route() is the interception mechanism. It handles API call interception, request header modification, response mocking, and resource blocking without requiring external proxy configuration or changes to application code. For test replay, page.routeFromHAR() captures complete request and response cycles and enables deterministic playback.
Playwright has one significant blind spot: service workers intercept requests before Playwright sees them. Sites using service-worker caching or service-worker fetch interception create an invisible layer. From Playwright's perspective, those requests simply do not appear. Many production applications depend heavily on service workers, and any traffic analysis that omits them is incomplete.
Choosing Between Them
For pure Chromium traffic analysis, either library works. Puppeteer offers tighter Chrome-native CDP access and a longer track record. Playwright offers cross-browser parity and stronger ecosystem momentum. The service-worker blind spot and the cache side effect are both architectural realities to build around explicitly, regardless of which you choose.
Proxy-Based Interception and What It Captures That Browser-Side Tools Cannot
The fundamental difference between proxy-based and browser-side interception is position. A proxy sits between the browser and the server at the network level. It sees traffic from all applications and devices, not just one browser tab or automation session. That scope changes what questions you can answer.
mitmproxy
mitmproxy is the primary open-source reference tool for MITM proxy work. It supports HTTP/1, HTTP/2, HTTP/3, WebSockets, and other TLS-protected protocols. The MITM mechanics are straightforward in principle: the proxy presents itself as the server to the client and as the client to the server, decrypting both sides and enabling full request and response inspection.
Three interfaces serve different workflows. The mitmproxy console is for exploratory, interactive analysis. mitmweb is a browser-based UI that resembles Chrome DevTools and has a low barrier to entry. mitmdump is command-line and scriptable, suited for automation pipelines in the same spirit as tcpdump. The Python addon API enables integration with external systems. Flows can be fed to Elasticsearch for Kibana-based visualization. HAR export via mitmproxy2har bridges to DevTools-compatible tooling. A reverse proxy mode is also available, forwarding traffic to a specific server when targeted service analysis is the goal.
One practical setup pattern worth knowing: running mitmproxy and a Chrome instance with a VNC server in separate Docker containers avoids installing the proxy's SSL certificate on the host system. Teardown is clean, and you do not leave a fake root certificate in your system trust store after the analysis is done.
InterceptSuite
InterceptSuite, an open-source tool that emerged in September 2025, targets a gap that neither CDP nor mitmproxy covers cleanly: non-HTTP protocols. Databases, SMTP, and custom proprietary protocols fall within its scope. It was developed in C for memory efficiency, includes native SOCKS5 support across platforms, supports Python extensions for protocol dissection, and ships with a C# GUI. TLS inspection is built in. For practitioners who need visibility into traffic that never touches HTTP at all, it fills a real gap.
What Proxy Interception Adds and What It Gives Up
The additions are significant. Proxy-based interception provides cross-application and cross-device capture, requires no dependency on browser automation APIs, and exposes traffic from native apps running alongside the browser. When the unit of analysis is an entire device or network segment rather than a single page, proxy interception is not optional; it is the only viable approach.
What it gives up is equally important. There is no access to the JavaScript execution context, no DOM state, no browser-internal events. Correlating network activity with page behavior requires combining proxy output with CDP output, using HAR as a common interchange format.
QUIC and HTTP/3 as the Growing Blind Spot in Chromium Traffic Analysis
Chromium-based browsers drove QUIC from a Google experiment in 2012 to a protocol now carrying a substantial and growing share of browser traffic. Roughly half of Chrome's traffic is QUIC-based. Adoption among websites has grown from a small minority to approaching half of all sites by 2025.
Why QUIC Defeats Traditional Interception
QUIC runs over UDP, not TCP. Packet-capture tools tuned for TCP streams see opaque UDP datagrams. There is no stream reassembly to perform; there is no cleartext metadata to correlate. QUIC encrypts nearly all transport-layer metadata, including most connection state information. What remains visible is minimal: the UDP packet header, a few header flags, and the Connection ID.
The contrast with TLS over TCP is instructive. In the TCP case, the HTTP payload is encrypted, but TCP metadata remains visible in cleartext. Sequence numbers, acknowledgments, and connection teardown are all observable. QUIC closes that window almost entirely.
The spinbit dispute captures the tension well. Network operators lobbied for a single visibility bit in the QUIC packet header that would allow passive measurement of connection performance. The bit was proposed, discussed seriously, and then not implemented in Chrome or on Google's servers. Operators who want that measurement capability do not have it through passive observation.
Impact at Each Layer
At the proxy layer, MITM proxies that terminate TLS can still decrypt QUIC sessions if the browser accepts the proxy's certificate. Active interception with certificate installation works. Passive, infrastructure-level monitoring without certificate installation loses visibility almost entirely.
At the CDP layer, browser-side tools see QUIC traffic as normal HTTP/3 requests and responses. The protocol is transparent at the application layer inside the browser. From Puppeteer or Playwright's perspective, an HTTP/3 request looks the same as an HTTP/1.1 request. The interception gap is entirely at the network and infrastructure level.
The practical implication is precise: for browser-automation analysis, QUIC is not a problem. For network-level capture and security monitoring, QUIC represents a significant and growing gap that requires active proxy termination rather than passive observation.
Matching the Interception Approach to the Analysis Task
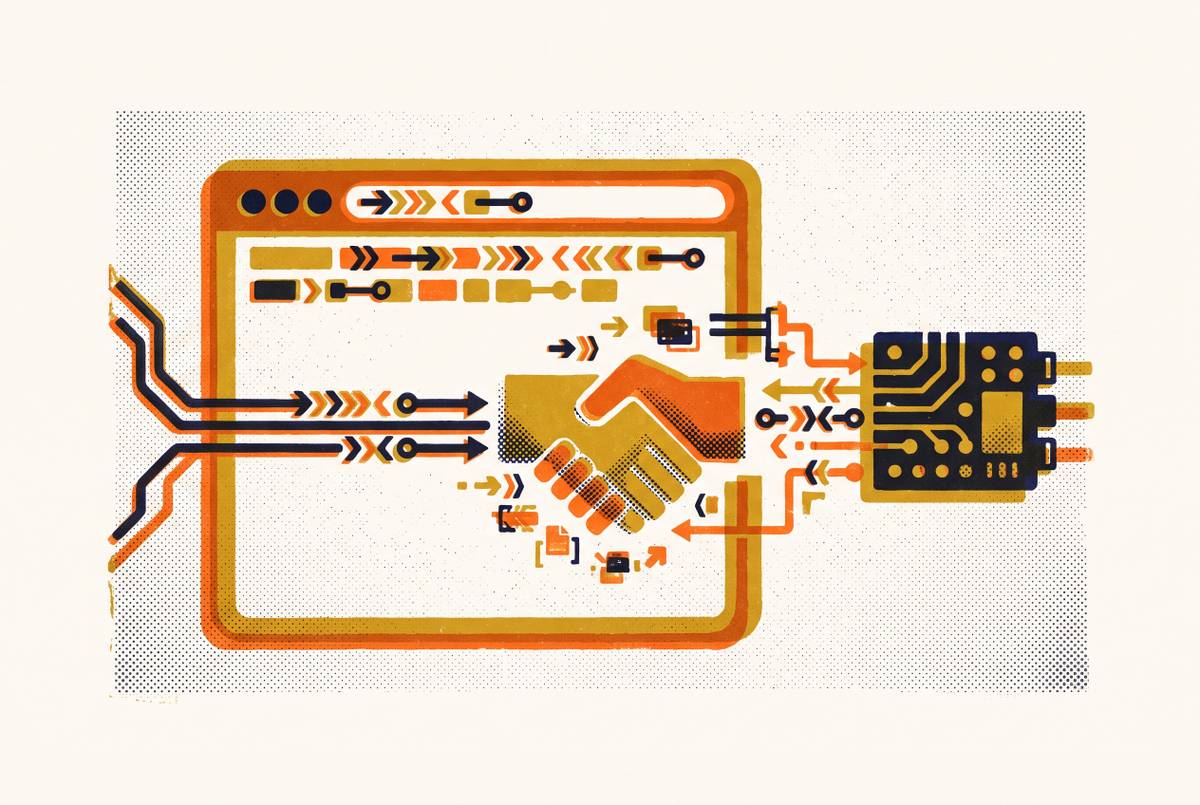
The core decision axis is simple: what is your unit of analysis? A single page or automation session points toward CDP-based tools. All traffic across apps and devices requires proxy-based interception. Both simultaneously means running the layers in parallel and correlating their outputs through HAR or matching request identifiers.
Scenario Mapping
Debugging a web application's API calls: Playwright's page.route() or the CDP Fetch domain is sufficient. No proxy is needed.
Performance analysis of page load: Puppeteer works well here, but account for the cache side effect. HAR recording enables waterfall inspection and replay.
Security testing or penetration testing across a device: mitmproxy in MITM mode with a certificate installed is the right choice. CDP does not have the cross-application scope this requires.
Non-HTTP protocol analysis: InterceptSuite fills a gap that neither CDP nor mitmproxy covers cleanly.
Enterprise browser traffic monitoring: the MV3 enterprise extension path, where blocking webRequest remains available under force-install policy, is viable. Alternatively, proxy deployment at the network edge gives broader coverage without depending on extension management.
Sites using service workers heavily: the proxy layer is required. Playwright alone has a blind spot here, and that blind spot is architecturally unavoidable with the current API.
The QUIC Contingency
If the target traffic is HTTP/3 and the analysis is at the network level, plan for certificate-based MITM proxy termination from the start. Passive capture is not viable. Browser-side CDP remains unaffected. This is a deployment planning issue, not a tool selection issue.
Combining Outputs
HAR format is the bridge between CDP-based tools and proxy tools. Both sides can export HAR. mitmproxy2har and Playwright's native HAR recording enable unified replay and side-by-side comparison. When you need to correlate what the browser saw with what the proxy saw, HAR is the common language.
What No Single Tool Provides
Full-stack visibility, from JavaScript execution context through to infrastructure-level packet flow, is not available from any single product. That reflects the architecture of the problem. Browser-internal state and network-level state live in different places, and accessing both requires tools positioned at both layers. The practitioners who struggle with Chromium traffic analysis are usually the ones who adopted a single tool and tried to stretch it beyond its natural scope, rather than accepting that the problem has two distinct dimensions that benefit from two distinct approaches working in concert.