Headless Browser JavaScript Error Monitoring in Scraping Pipelines
Catch silent failures by instrumenting the browser's runtime, console, and network layer separately.
Roughly 94% of modern websites lean on client-side rendering, according to Browserbase. That means most scraping targets need a real browser executing real JavaScript, not a simple fetch of raw HTML. And that single fact rewires the entire error-handling problem: the failures a pipeline needs to catch no longer show up as tidy HTTP status codes sitting in a response header. They live inside the browser's own runtime, its console, and its network layer, three places a lot of scraping code never bothers to look.
Headless mode makes this worse before it makes it better. Strip away the visible browser window and you also strip away the DevTools panel a developer would normally have open, the console output that would normally scroll past on screen. Run the same script headed, and a broken selector throws something a person can see. Run it headless in CI, and the same failure just disappears into a job that reports "success" while returning an empty table.
The symptom pattern is familiar to anyone who's chased this down: tables that load empty with no exception at the Node.js level, HTML that structurally looks fine while three fields are quietly missing, scripts that pass on a laptop and fail silently in a Docker container three timezones away. Sometimes there's a "page crashed" or "execution context destroyed" message with no trace before it, which is about as useful as a doctor's note that just says "something happened."
The stakes are not small. The web scraping market was valued at USD 1.34 billion in 2025 and is projected to reach USD 3.49 billion by 2031, growing at a 17.39% compound annual rate. At that scale, silent data loss isn't a bug report, it's a line item. This piece is about the instrumentation discipline that keeps it from becoming one: what errors actually show up in a headless pipeline, how Playwright and Puppeteer expose them, when to go around those libraries entirely and talk to the Chrome DevTools Protocol directly, and how to turn a flood of error text into something a pipeline can act on instead of just logging.
The four categories of JavaScript errors that scraping pipelines actually encounter
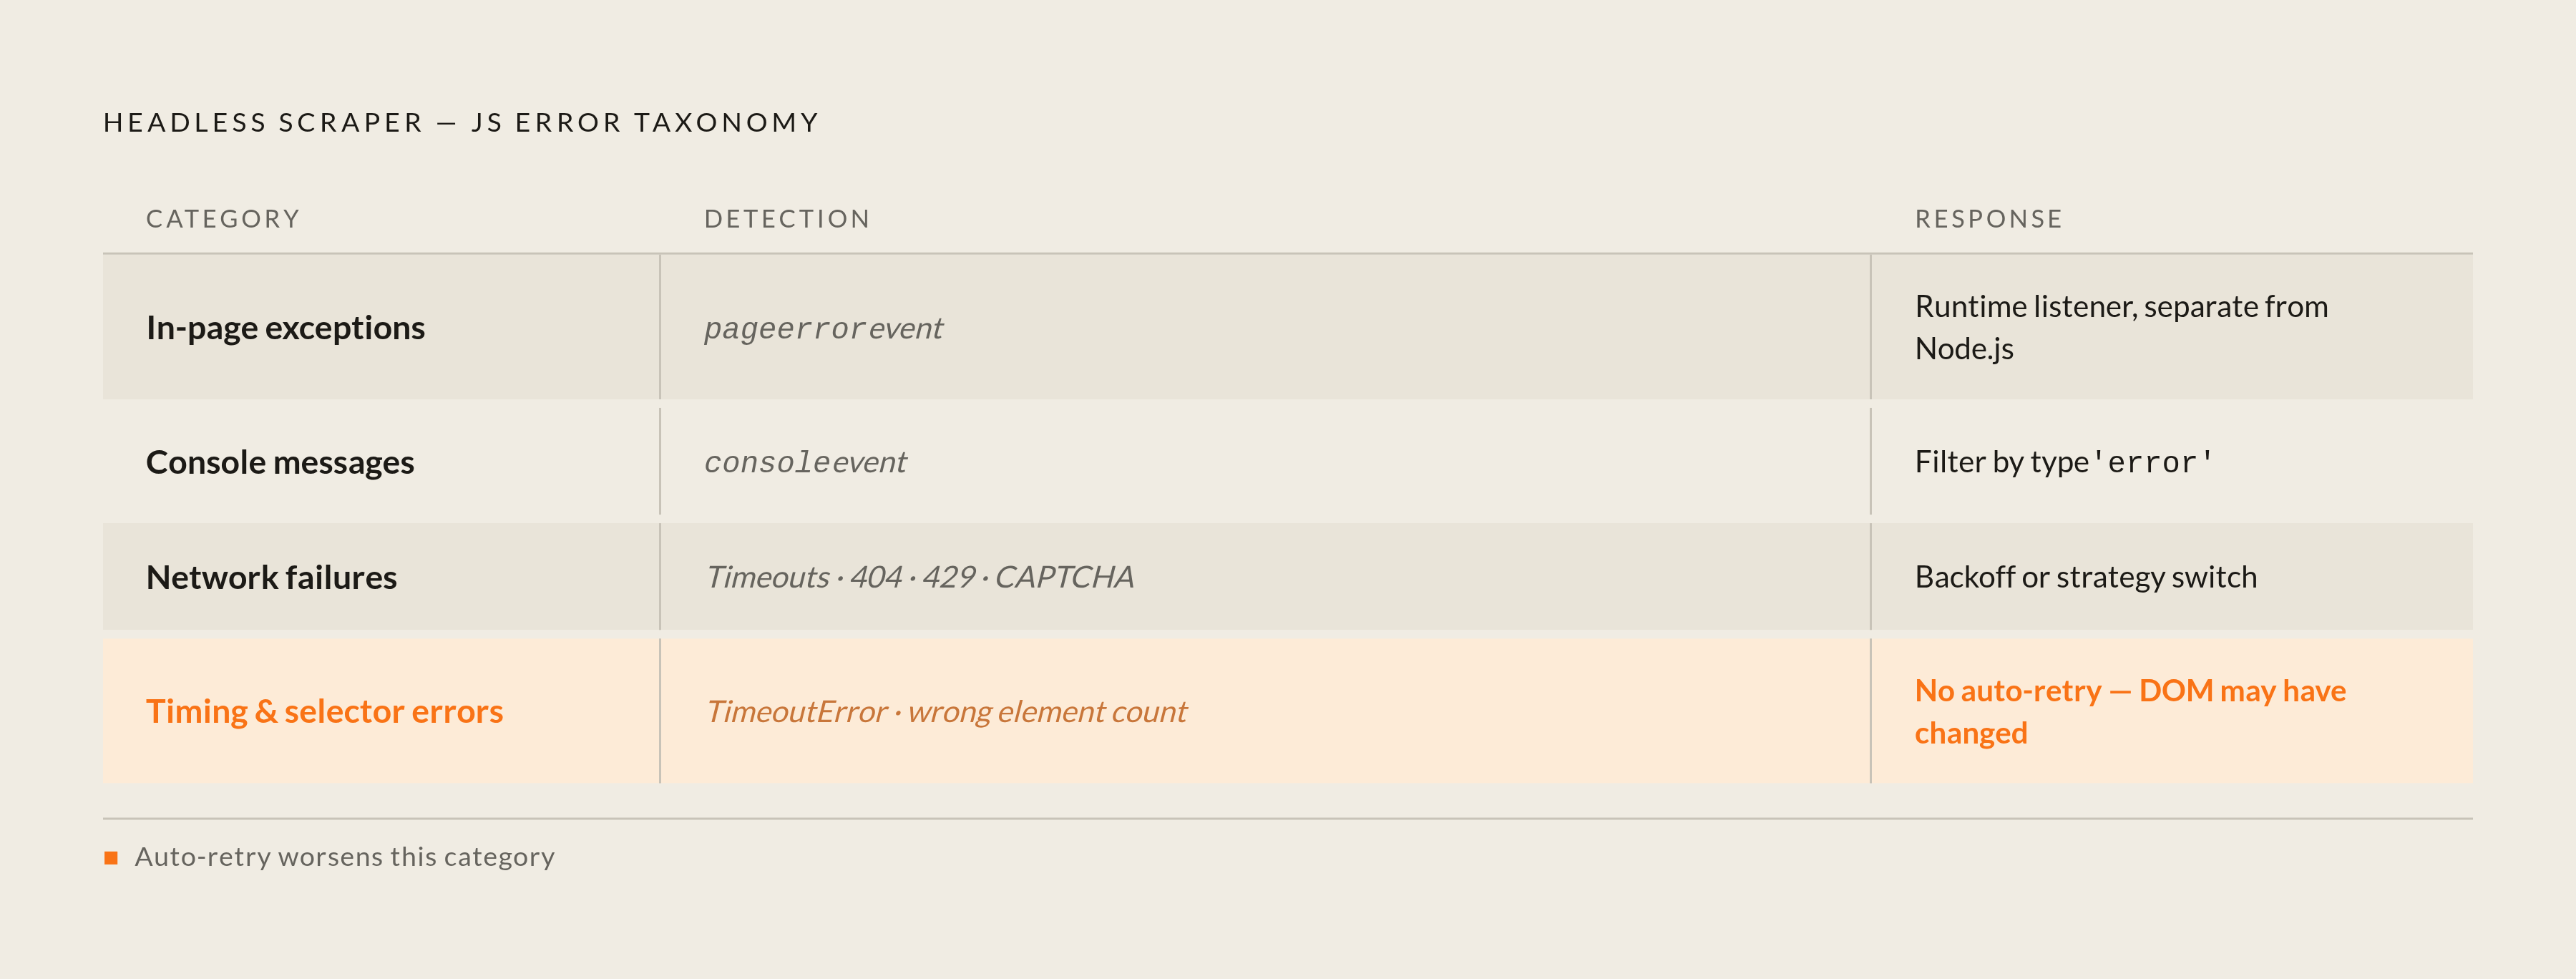
Not every JS error behaves the same way, and treating them as one undifferentiated blob is exactly how instrumentation gaps happen. There are, in practice, four categories worth separating.
The first is the uncaught in-page exception: an error thrown by the target site's own code that its own error handlers never catch. This kind of failure can quietly abort the rendering of the exact data the scraper came for, and it's worth stressing that it has nothing to do with the scraper's own Node.js exceptions. It happens inside the browser runtime, a different address than the one most error handling code is watching.
The second category is console messages: errors, warnings, logs, the whole family. A site's own code can log meaningful state to the console without ever throwing an exception. There are technically eighteen console message types, though in practice only a handful matter: error, warning, log, debug, and info. Console errors are not uncaught exceptions, and that distinction isn't pedantic. It means they need their own capture logic, separate from whatever catches exceptions.
Third: network-layer failures. Timeouts, 404s, server-side blocks, CAPTCHA walls, brief network drops. None of these throw a JavaScript exception, but they can stop the JS that renders the data from ever running in the first place. Anti-bot responses deserve their own mental bucket here too, since a rate limit or CAPTCHA doesn't fail to load. The page loads just fine; it just loads the wrong page.
Fourth, timing and selector errors. A TimeoutError happens when Playwright or Puppeteer waits for a navigation, a click, or an element to become visible, and it never does. Usually that's a dynamic element loading late, a slow server, or a straightforward race condition between the page's rendering and the scraper's extraction call. Selector errors are a cousin of this: the target site's DOM shifts, and a locator that worked perfectly yesterday now finds zero elements, or finds three when it expects one.
Why bother with a taxonomy at all? Because each of these four wants a different listener, a different fix, and a different alert threshold. Lump them together and the fix for one becomes noise for the other three.
How Playwright and Puppeteer expose these errors through their event APIs
Both tools share the same basic model: event listeners attached to a page object. Where they differ is in surface area and how deep they let you go.
In Playwright, the pageerror event fires whenever an uncaught exception happens inside the browser context. The pattern looks something like page.on('pageerror', exception => { errors.push(exception.message); }). That's separate from Playwright's own thrown errors, like TimeoutError, which need their own handling entirely. Worth noting: Playwright's strict mode, where a locator must match exactly one element or the whole thing fails immediately, actually works in a monitoring pipeline's favor. A loud, explicit failure beats a silent wrong match every time.
Console capture in Playwright works through the console event, which fires on every browser console call. The ConsoleMessage object it hands back carries the message type, the text, the URL, the line number, arguments, the works. Filtering by type, if (message.type() === 'error'), isolates the errors worth caring about from the debug-log chatter. And it's worth repeating: a console error and a pageerror event are not the same thing. A site calling console.error() on purpose does not trigger pageerror. They're different channels reporting different kinds of trouble.
Puppeteer works similarly. Its console event on the page object captures browser-side console calls, and without that listener attached, whatever the browser logs stays invisible to the Node.js process running the script; page.on('console', msg => console.log('PAGE LOG:', msg.text())) is the standard pattern. Puppeteer currently sits at tens of thousands of GitHub stars, according to Latenode, which means a large share of existing scraping infrastructure runs on it already.
The practical difference between the two comes down to abstraction level. Playwright's API works across Chromium, Firefox, and WebKit, but it sits a layer above the wire. Puppeteer's connection to the Chrome DevTools Protocol is more direct, which opens up lower-level metrics like Performance.getMetrics() or Performance.enable(). Playwright can reach those same metrics through its own CDP session support, but Puppeteer gets there more directly. For a pipeline that only ever targets Chromium anyway, that difference in directness can matter for performance and network diagnostics.
What neither library catches by default is the quietest failure of all: nothing thrown, nothing logged, just a JavaScript variable that's undefined instead of populated, and a scraped field that's wrong without ever announcing itself. Passive listeners don't catch that. Only an active check on the extracted value does.
Using the Chrome DevTools Protocol directly for deeper instrumentation
Here's the thing both libraries have in common underneath the hood: every API call in Playwright and Puppeteer eventually turns into a CDP command sent over a WebSocket to the browser process. Understanding that translation layer opens up instrumentation options neither library's own API surfaces.
CDP gives access to things the library APIs don't hand over cleanly. Enabling the Log domain directly captures browser-level log events, console.warn, console.error, console.log, at the protocol layer rather than through a page listener. It also allows intercepting and modifying requests at the protocol level, which is genuinely useful for telling a 429 rate-limit response apart from an honest 404. It lets tooling attach to a browser session that's already running, no restart needed, and it's the layer that lets a script connect to a remote browser managed by outside cloud infrastructure.
So when does raw CDP actually earn its complexity? For routine error capture, it mostly doesn't; the library's event API, pageerror and console, is simpler and does the job. But for performance metrics, protocol-level request rewriting, or attaching to a session someone else is running, CDP is the tool. Playwright even splits the difference by exposing a CDP session through page.context().newCDPSession(), giving a script both the high-level convenience and the protocol-level access in the same file.
The payoff is a distinction that actually changes what a pipeline does next: a scraping job instrumented at the CDP level can tell the difference between a JavaScript error that stopped rendering and a network failure that stopped the JavaScript from loading at all. Those look identical from a distance. They call for entirely different fixes.
Building error classification into the pipeline rather than just logging everything
Catching errors is necessary. It is not sufficient. An unsorted stream of console messages and pageerror strings turns into noise fast, and noise is the kind of thing engineering teams learn to tune out, which defeats the entire point of catching it in the first place.
The classification problem shows up everywhere once you look for it. A timeout caused by a genuinely slow target server needs a different response than a timeout caused by a broken selector, even though both throw the same TimeoutError. A 429 calls for backoff; a 404 on a URL that worked fine last week is a signal that the site's structure changed, and that's a decision for a human, not a retry loop. An uncaught exception on the target page might not even matter, depending on whether the code that broke was anywhere near the rendering path for the data actually being scraped.
One pattern worth building toward is what might be called an error resolution matrix: each error category, timeout, network, permission, selector, maps to a specific automated action rather than a generic retry-and-hope. A failed job automatically grabs a screenshot and a structured log entry at the exact moment it fails. Errors that look flaky get one automated re-run before the job gets marked as failed, which stops false positives without papering over genuine breakage. One engineering team running this kind of matrix reported test flakiness dropping by more than 70%, with error analytics consolidated directly into CI output instead of scattered across log files nobody opens.
What actually gets classified on: the source of the error (in-page JS, network, or tool-level like TimeoutError), the severity (did extraction still succeed despite the error, or is the value definitely garbage), and the recurrence (a one-off blip versus a pattern showing up across dozens of pages or jobs). Screenshots and HAR files earn their keep here too. A log line that just says "TimeoutError" is nearly useless six months later; a screenshot of the exact page state at the moment of failure turns that same log line into something reproducible.
Retry logic and backoff strategies that complement error monitoring
Error monitoring without retry logic tells you what broke without doing anything about it. Retry logic without monitoring either loops forever or quietly papers over failures that were trying to tell you something. Neither one works alone.
Exponential backoff is the baseline everyone should already be running: wait after a failure, then wait longer after the next one. A sequence like 1 second, then 2, then 4 between retries is a standard approach to reducing how often a pipeline hits rate limits. Wrap every page request in that logic and a single flaky response stops being able to take down a large multi-page job on its own.
Jitter, randomness added to the wait times, matters more than it sounds like it should. Without it, a fleet of concurrent scrapers all retry at exactly the same moment, which produces a synchronized burst of traffic that looks a lot like a denial-of-service attack to whatever's watching on the other end, and can trigger the exact IP blacklisting the pipeline was trying to avoid. According to a 2025 WP Engine report, 76% of bot traffic online is unverified, which makes it a prime target for rate limiting regardless of intent. A pipeline running without jitter and backoff is disproportionately likely to get swept up in that net.
Classification from the previous section is what makes retry logic smart instead of just persistent. A timeout on a specific URL: retry with a longer wait. A selector error: don't retry automatically at all, because the DOM has probably changed, and retrying just produces the same wrong result, or worse, a different wrong result that looks plausible. A network failure: retry with backoff, standard case. An anti-bot block: don't retry the same way at all, switch strategy, rotate the proxy, change the user agent, because doing the identical thing twice just confirms to the target site that it correctly identified a bot.
Log what failed and why before retrying anything. That audit trail is the only record showing whether a job's eventual "success" was clean, or whether it limped across the finish line after five silent failures that are only going to get worse next week.
Integrating headless browser error data into a broader observability stack
By 2025, observability had already moved past the old three pillars of metrics, logs, and traces, toward AI-assisted analysis and automated remediation layered on top of them. Scraping pipelines generate all three pillar types on their own, which means they should be feeding them into that stack rather than sitting off in their own isolated logging silo.
OpenTelemetry has become the standard instrumentation layer for this, the common format for getting telemetry out of an application and into whatever backend is watching it. Scraper error events, tagged by category and severity from the classification work above, can go out as OTel spans and logs, which puts scraping pipeline health on the exact same dashboards as the rest of the infrastructure instead of off in its own corner that nobody checks until something's already broken.
Sentry fills a different role: code-level error capture, release health tracking, application performance. One distinction worth being precise about: OpenTelemetry does not send errors to Sentry on its own. The Sentry SDK has to be added separately for error monitoring; OTel's job is tracing and metrics transport, not error capture. For a scraping pipeline, Sentry's grouping and alerting on recurring error signatures earns its place fast, particularly for catching the moment a target site ships a change that starts throwing a brand-new class of JavaScript exception nobody's seen before.
Grafana sits on top as the visualization layer, pulling in metrics through Prometheus or Mimir, logs through Loki, traces through Tempo, all fed by the OTel instrumentation underneath. A dashboard built on that can show error rate by job, error rate by target domain, retry frequency, and the correlation between JS errors and whatever downstream data quality metrics matter most.
What actually gets emitted from the pipeline into that stack: a span per page visit tagged with the target URL, the job ID, and the browser context; a log event for every captured pageerror and console error, carrying its classification tag; a metric counter tracking retries by error category, which turns out to be the earliest warning sign available that a target site is quietly changing its behavior. The retry counter climbs days before anyone notices the extracted data looks off, and that gap, between the counter moving and a human noticing, is exactly the window this whole instrumentation exercise exists to close.