Headless Browser Network Throttling for Performance Testing
Simulating slow networks in automated tests catches real-world performance gaps lab runs miss.

A headless browser runs the full engine, HTML parsing, CSS rendering, JavaScript execution, without ever drawing a window on screen. It's the same Chromium or Firefox code doing the same work a real browser does; the output isn't a synthetic guess. That's why headless testing scaled so fast in CI/CD pipelines: per research from testguild.com, headless runs finish 2x to 15x faster than headed ones. But speed bought engineers a blind spot, because unthrottled headless tests run on data-center connections, fast, stable, low-latency, and almost nobody's actual internet. This piece walks through how throttling closes that gap, which method to use when, and how to build tests that catch problems before users do.
Why the gap between lab results and real-user experience keeps widening
The 2025 Web Almanac put a number on the problem: only 48% of mobile sites and 56% of desktop sites hit good Core Web Vitals scores. Flip that around and well over half of mobile visits land on pages that fail by Google's own bar. There's progress buried in there too; mobile good First Contentful Paint stood at 51% in 2024, and poor FCP dropped from 18% to 16% by 2025, a modest but real improvement. Real, but slow.
Here's the part that should bother anyone running performance tests on a MacBook connected to office fiber: those gains aren't spread evenly. They pile up on high-end devices sitting on fast networks, while users on budget phones and shaky connections fall further behind every cycle. The fast get faster. Everyone else stays flat, or slides backward.
Then Google moved the goalposts. In March 2024, Interaction to Next Paint replaced First Input Delay as a Core Web Vital. FID only measured the delay before the browser started processing an interaction; it didn't care what happened next. INP measures the full round-trip, interaction to visual paint, across every interaction on the page, not just the first one. That makes it far more sensitive to network-induced jank and resources that load late and stall the render.
Put those two facts together and the implication is blunt: a test suite running on fiber will undercount INP problems that only show up under real mobile latency. The lab looks fine. The phone in someone's hand, on a train, with two bars of LTE, does not. That gap isn't a rounding error engineers can shrug off; it's the whole reason throttling exists.
The three throttling methods and where each one breaks down
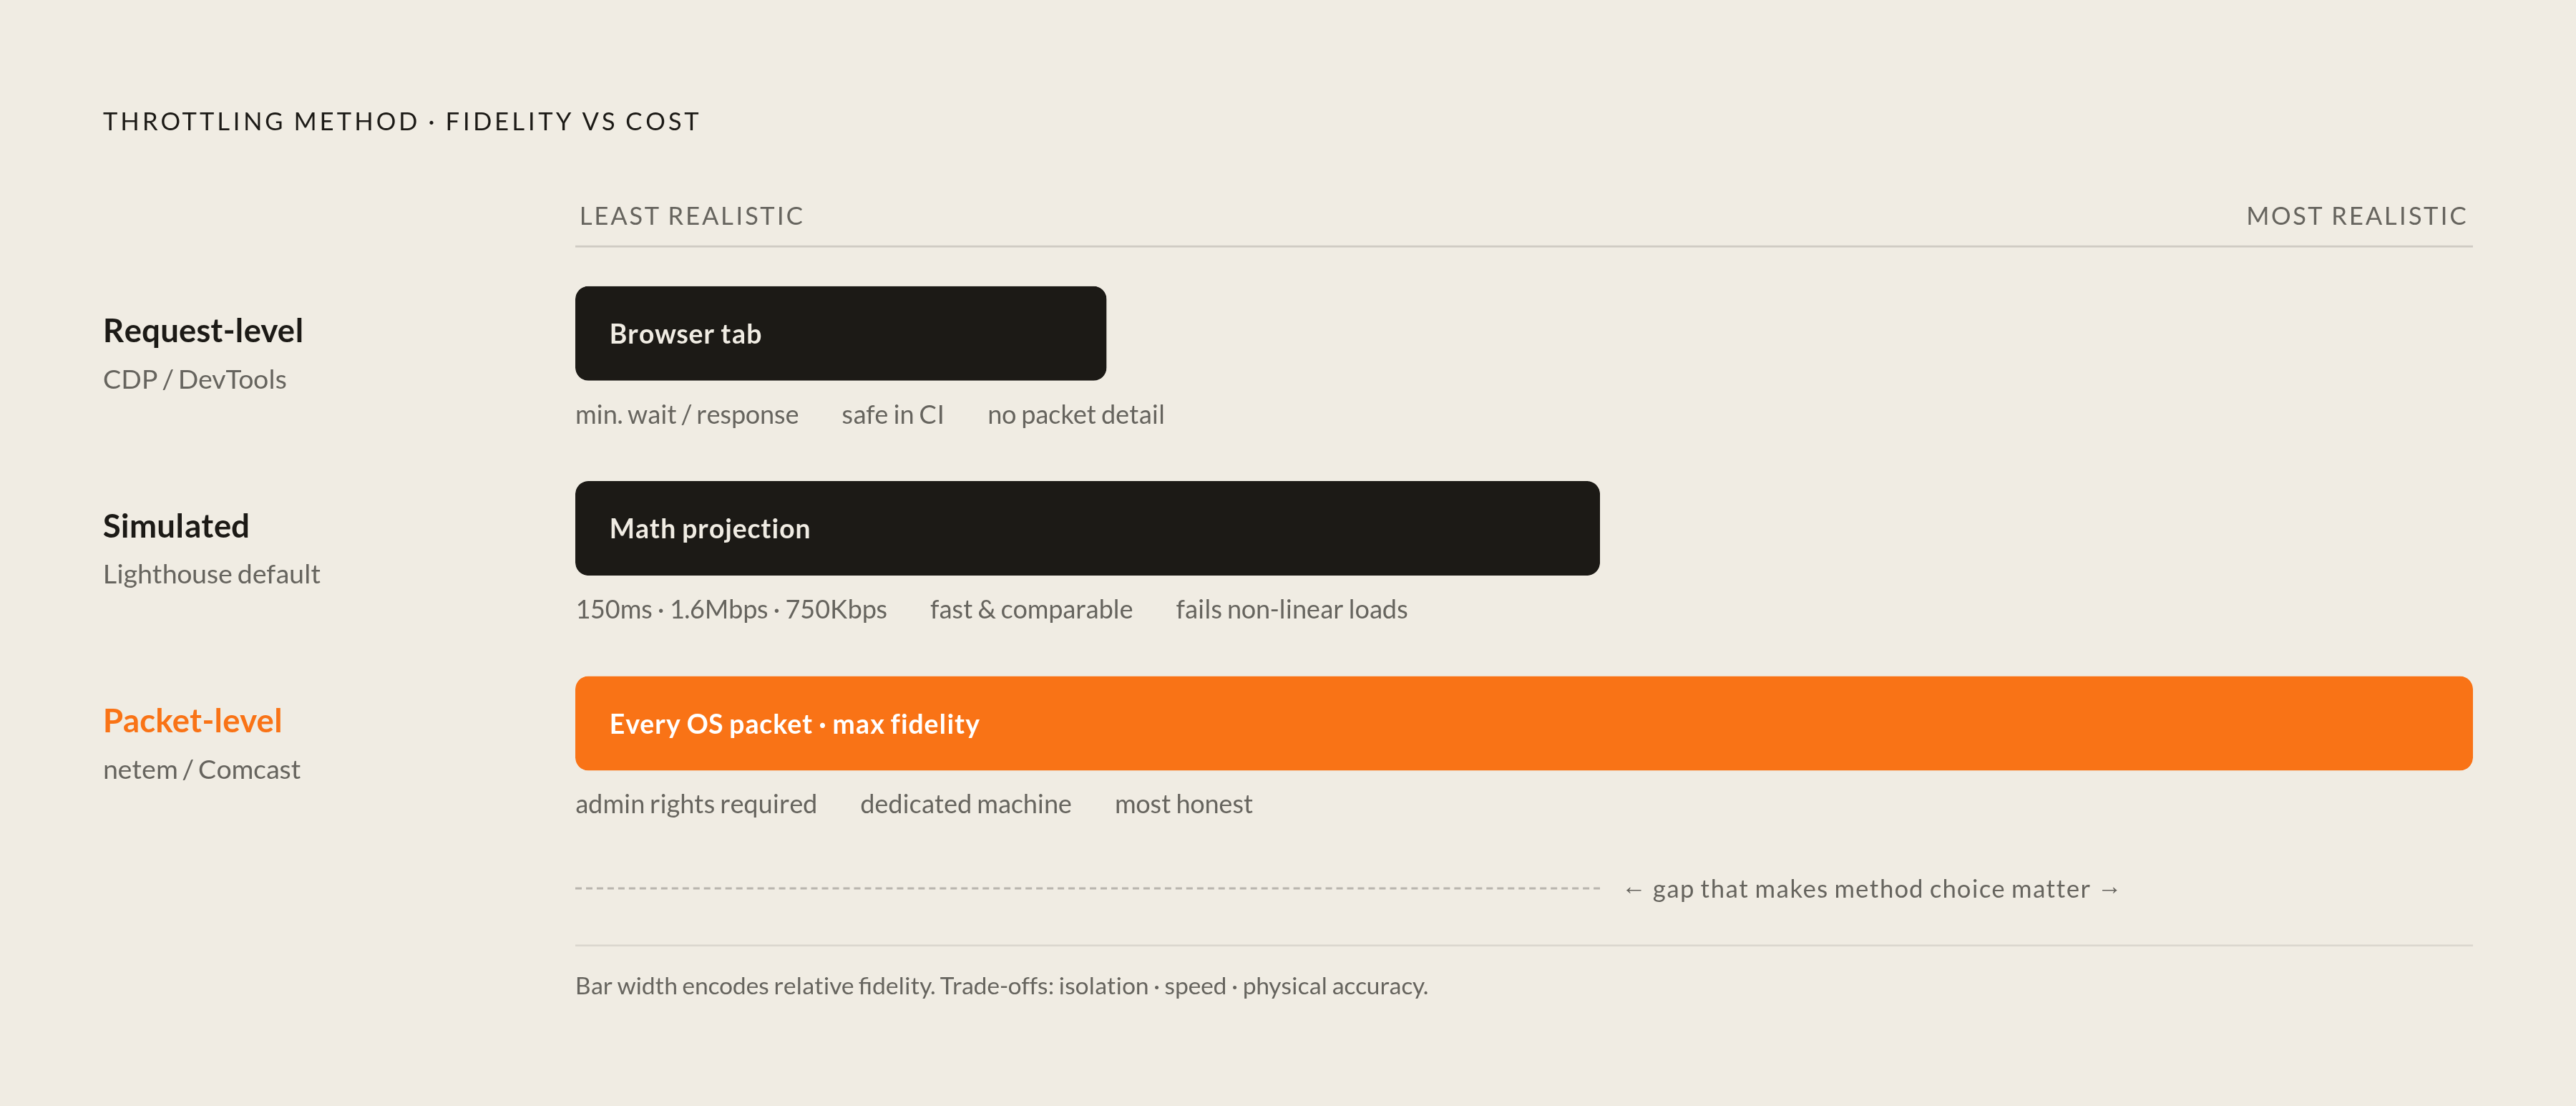
Three methods dominate here, and they are not interchangeable. Each adds delay at a different layer of the stack, and each fails to copy something real networks do. If there's one habit worth breaking up front, it's treating any one of these three as a stand-in for the other two. It won't hold up.
Request-level throttling, the kind built into Chrome DevTools and exposed via CDP, works at the browser tab level. Only that tab slows down, which makes it safe to run in shared CI boxes where other jobs are chugging along on the same machine. The catch: it tacks a minimum wait onto each request's response, but it has no idea what a packet round-trip actually looks like, or the small timing quirks of a real server connection. Actual mobile latency happens at the packet level, so this method looks more precise than it really is. Chrome DevTools added a nice trick: right-click a single request and throttle just that one, on its own. Handy for figuring out exactly how much one slow third-party script is dragging down LCP, without slowing the whole page down to check.
Simulated throttling is what Lighthouse defaults to, and it's the one most teams should reach for first, mostly because it's cheap and it's comparable. It loads the page on a fast connection, then does the math on what the load would have looked like on a slower one. No actual throttled transfer happens; it's a projection. The preset targets roughly the 85th percentile mobile connection: 150ms latency, 1.6Mbps down, 750 Kbps up, zero packet loss. It runs fast, and it tends to track real-world network behavior better than DevTools throttling on its own. The risk shows up on pages with tangled or non-linear loading patterns, where the simulation and the real browser start to disagree with each other. Worth noting: DevTools' Slow 4G preset is calibrated to match Lighthouse's mobile preset specifically, so lab runs and PageSpeed Insights data can sit side by side without an asterisk.
Packet-level throttling is the most physically honest of the three, because it adds delay at the OS level to every single packet. On Linux, that's netem; an open-source tool called Comcast wraps it for cross-platform use, though the shared name with the cable company can trip people up on the first search. The cost is real: it needs admin rights, and it slows the whole machine, not just the browser tab running the test. That's exactly why Lighthouse leaves it alone. Slowing down every other process on a box to get one accurate page load is a bad trade for a tool meant to run anywhere, on anyone's laptop. Packet-level throttling belongs on a dedicated CI agent or an isolated VM, somewhere nothing else is running that would notice or care.
So the decision comes down to three questions, not one grand framework. Need tab isolation on a shared machine? Reach for DevTools or CDP. Need speed and a number that lines up with Lighthouse or PageSpeed Insights? Simulated throttling fits. Need maximum fidelity and a spare machine? That's when packet-level throttling earns its cost, and only then; running it by default on a shared CI runner is how a whole test suite quietly slows down for no reason anyone will remember to debug six months later.
The CDP method that powers nearly all Chromium throttling
Nearly every flavor of Chromium-based throttling, no matter which framework sits on top of it, routes through one call: Network.emulateNetworkConditions. That's the same Chrome DevTools Protocol method the Network panel's UI uses under the hood; the presets in the dropdown are just pre-filled arguments to this exact function.
Four parameters make up the whole surface: offline (simulate total connectivity loss), downloadThroughput (max download in bytes per second, -1 disables the cap), uploadThroughput (same idea, upload direction), and latency (added round-trip delay in milliseconds).
Here's a fact worth sitting with: frameworks that never shipped a public throttling API, early Playwright being the clearest case, had CDP access the whole time. The capability was always there. It just sat one layer below what the documentation talked about, waiting for anyone willing to open a CDP session directly and use it.
CDP also underlies Emulation.setCPUThrottlingRate, and pairing that with network throttling gets closer to a mid-range mobile device rather than just a slow pipe. Treat CPU throttling as a rough guideline, though, not a stand-in for the real thing. Actual device performance depends on cache size, thermal state, core count, chip architecture, none of which a throttling multiplier fakes convincingly. A 4x CPU slowdown factor on a test machine's processor does not behave like a genuinely underpowered mobile chip running the same workload; it's the same math applied to different silicon underneath.
One ceiling matters more than any preset number: CDP is Chromium-only. Firefox and WebKit never built this protocol in, so every CDP-based throttling trick covered here, and honestly most of what exists in the wild, is scoped to Chrome and Chromium. Anyone testing across browsers needs a separate plan for the other two engines, full stop.
Reference presets and what their numbers actually represent
Chrome DevTools' built-in presets have shifted over time; the old GPRS, DSL, and WiFi profiles gave way to Slow 3G, Slow 4G, and Fast 4G, with custom profiles sitting under Settings → Throttling for anyone who wants exact control. If Chrome User Experience Report field data is switched on in the Performance panel, DevTools can even suggest a preset matched to a site's actual visitor population, pulled from real usage rather than a guess.
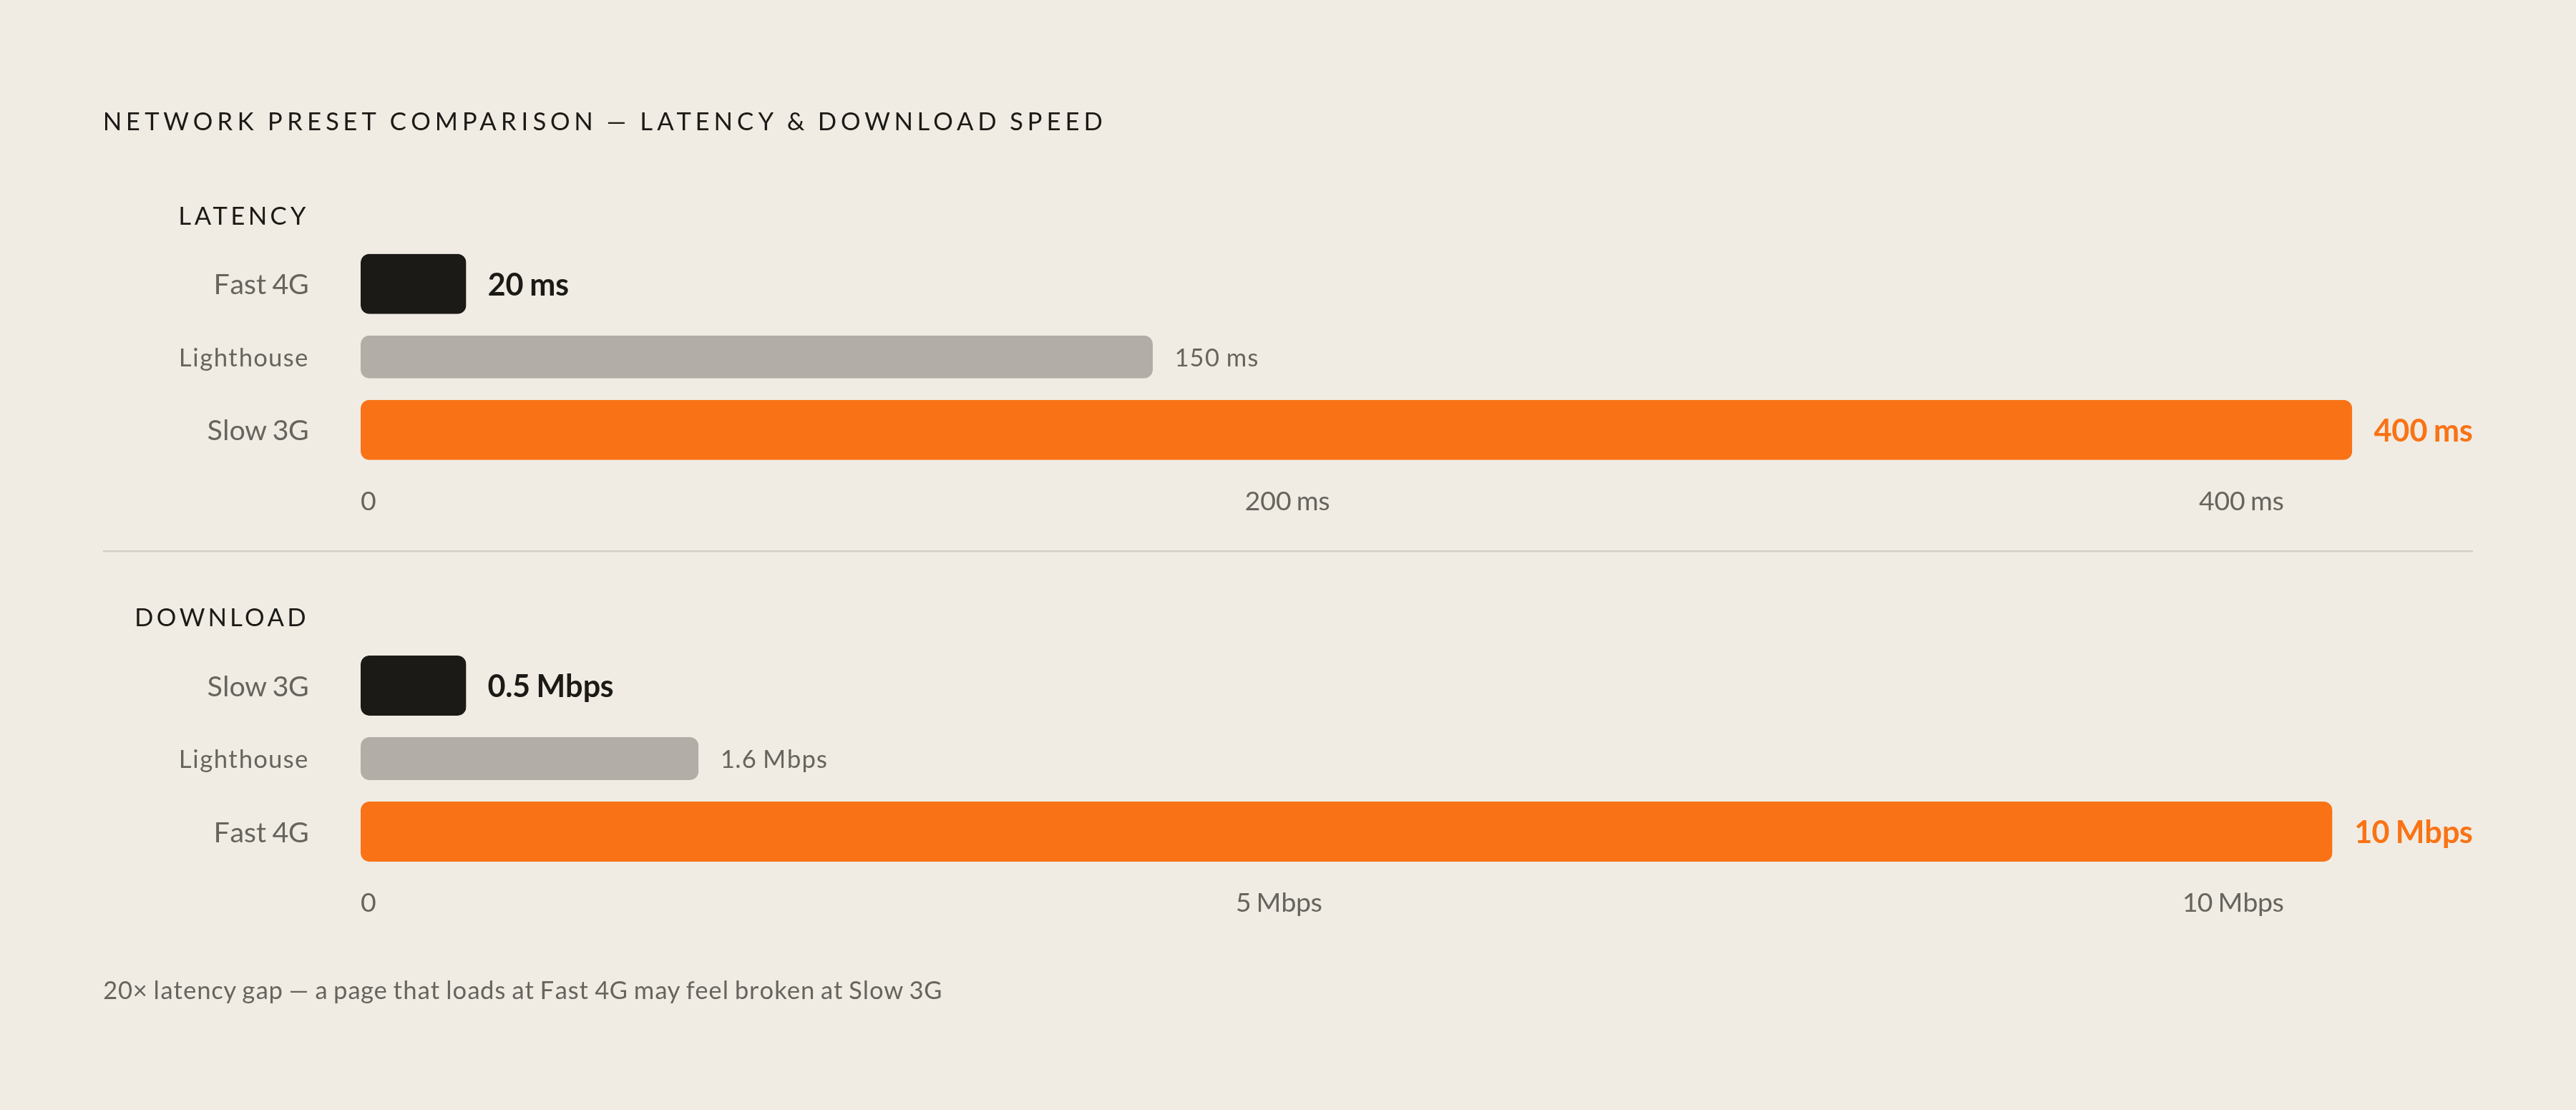
Puppeteer ships its own reference values through PredefinedNetworkConditions. Slow 3G comes in at 400ms latency and 500 Kbps download. Fast 4G sits at 20ms latency and 10 Mbps download. Custom profiles built for real testing tend to land somewhere like this: a Slow 3G variant at 150ms latency, 500,000 bytes/s down, 250,000 bytes/s up; a Fast 4G variant at 20ms, 10 Mbps down, 5 Mbps up; and for the patient, a satellite-style simulation running 1,000ms latency alongside otherwise fast throughput.
Look at the spread between Slow 3G and Fast 4G and the scale of the problem gets obvious fast: 400ms versus 20ms latency, 500 Kbps versus 10 Mbps download. That's not a small gap; it's the difference between a page that feels instant and one that feels broken. A site that sails through testing at Fast 4G can fail badly at Slow 3G, and testing only one of the two tells an engineer almost nothing about the other. Lighthouse's mobile preset, at 150ms and 1.6Mbps, sits between these extremes and stands in for roughly the 85th percentile mobile connection. Treat it as a reasonable baseline, not a worst case; the actual worst case is still Slow 3G, or worse.
Implementing throttling in Puppeteer, Playwright, and Selenium
Puppeteer makes this the most straightforward of the three, and it's worth saying plainly: for teams starting from zero, this is where to start. Page.emulateNetworkConditions() takes a NetworkConditions object, or null to turn throttling off entirely. Pull a standard preset from PredefinedNetworkConditions, or hand it a custom object for exact control over latency and throughput. Pair it with Emulation.setCPUThrottlingRate via CDP to get a fuller picture of a mid-range phone, not just a slow pipe hooked up to a fast machine. Puppeteer's direct CDP access also suits single-page apps, logged-in flows, and paginated content, where fine control over the page lifecycle actually matters. Passing null resets things cleanly, which matters more than it sounds like in a suite running dozens of tests back to back; leftover throttling from a previous test is exactly the kind of bug that produces failures nobody can reproduce twice.
Playwright never shipped a public throttling API. The capability sat in the underlying engine the whole time, but nothing stopped anyone from opening a CDP session and calling Network.emulateNetworkConditions directly, same as Puppeteer does under the hood. Scope works differently here: page-level settings override context-level, and context-level overrides browser-level, which matters when different tabs in a multi-tab test need to simulate different networks at the same time. The hard limit: this only works on Chromium. Try it on Firefox or WebKit and Playwright throws an immediate, unambiguous error, so tests either target Chromium specifically or guard the throttling call behind a browser-type check. Playwright's request interception API works across all three engines, and it pairs well with throttling for faking failed requests or altered responses.
Selenium gets there through the same CDP bridge. The DevTools interfaces in the Java and Python bindings wrap Network.emulateNetworkConditions just like the others do. Worth flagging, though: Selenium's test stability rate is widely reported to run lower than Playwright's, with a higher rate of CI retries. That matters more once throttling enters the picture, because throttled tests already run slower by design; stacking retries on top of that adds up fast. If a team is picking a framework today with throttling as a real requirement, that stability gap alone is reason enough to lean Playwright. Selenium's language support and its footprint in existing enterprise suites keep the CDP throttling technique worth knowing regardless, if only because plenty of teams aren't starting from a blank slate.
The metrics throttling surfaces that unthrottled tests miss
Large hero images and render-blocking resources are invisible on a fast connection. The same page under Slow 3G suddenly has an LCP dominated by exactly those assets. Nothing about the code changed, only the network did; the code's existing flaws just had nowhere left to hide once the connection stopped covering for them.
INP tells a similar story. Interactions that trigger network fetches, search boxes, filters, form submissions, pile up latency that simply doesn't show until round-trip time reflects something real. Throttled testing is the only way to catch these failures in a lab; on fiber, the fetch comes back before anyone notices it happened at all.
The December 2025 single-request throttling feature in DevTools answers a question unthrottled testing structurally can't: how much is one specific third-party script, an analytics tag, an ad unit, dragging down LCP on its own? Isolate the request, throttle it alone, and the guess turns into a number.
Connection negotiation overhead, TLS handshakes, DNS lookups, TCP slow-start, behaves differently under request-level throttling than under packet-level throttling. Only packet-level throttling captures these honestly, because only packet-level throttling operates at the layer where these mechanisms actually happen.
And then there's the ugliest failure mode: progressive enhancement that simply doesn't hold up under constraint. Content that renders fine on a fast connection can fail to render at all, or render broken, under Slow 3G. Throttled tests catch these as functional failures, not slow numbers on a chart. That's a different category of bug entirely, and it's the one unthrottled testing has no way of finding, ever.
Run a matrix across Slow 3G, the Lighthouse mobile preset, and Fast 4G, ideally with CPU throttling layered in, and the combined result shows engineers where the actual floor of the user experience sits, not just the average.
Structuring throttling tests so they produce actionable signals
Run throttled tests on every deployment, treated as a permanent part of the pipeline rather than a quarterly audit someone remembers to schedule and then quietly doesn't. Regressions compound without making noise; a page that gains 200ms of LCP with every release looks fine in isolation and bad six months later, and by then nobody remembers which commit started it.
Test at more than one preset, and treat a single preset as close to useless on its own. Slow 3G finds the floor, the Lighthouse mobile preset gives a number comparable to PageSpeed Insights, and Fast 4G checks that the ceiling holds up too. One preset produces one data point; a spread across three is what actually tells a team something worth reading.
Packet-level throttling needs its own dedicated CI agent or container, kept away from parallel jobs, so throttling the OS for one test doesn't quietly slow down three others running next to it. In Playwright specifically, page-level CDP throttling scope is worth using on purpose for multi-step flows: a CDN-served app shell might load fast while the API-backed data underneath loads slow, and testing both under one flat condition hides that split completely.
Pair network throttling with CPU throttling whenever the audience skews mobile. A fast network sitting on top of a slow CPU can pass every network-based metric while still failing hard on a real mid-range Android phone. The processor was the bottleneck the whole time, and the network metrics alone never would have shown it.
Set budget thresholds per preset, not globally. A 2.5-second LCP target makes sense on Fast 4G. It's an unreasonable ask on Slow 3G, and holding a team to it there just produces noise nobody trusts. Write down which budget applies to which network condition so nobody argues about the wrong number in a postmortem three months from now.
Track the trend line, not just pass or fail. Throttled metrics tend to slide gradually as pages pick up more third-party scripts and heavier assets over time, and a chart shows that drift months before a hard threshold finally trips.
One last thing, and it's the part teams skip most often: check outliers on real hardware. CDP-based throttling is an approximation of network and device conditions, a good one, but an approximation all the same. When a throttled test flags a severe regression, run it on an actual mid-range device before calling the finding blocking. The simulation pointed someone in the right direction; confirming it on real hardware is what makes the finding trustworthy.